

Most embedded systems use more than one power rail and many use four or more. A single IC, such as an FPGA, DSP or microcontroller can require several power rails and these may have specific timing requirements. For example, a chip manufacturer may recommend that the core voltage supply stabilize before the I/O supply voltage is applied. Or a manufacturer may require that supplies come up within a specified time relative to each other to avoid prolonged voltage differences on various supply pins. The power-on sequence between processors and external memory can also be critical.
Chip manufacturers may specify that particular supplies must come up monotonically to avoid multiple power-on resets. This can be challenging since inrush currents can place high transient demands on point of load regulators. In this case the shape of power rail startup is as important as the timing sequence.
Once you combine the various chip supply requirements, bulk supplies, reference supplies and multiple point-of-load regulators for other ICs in a design, you can get up to seven or eight power rails in a hurry.
Using a 4-channel oscilloscope to verify power rail timing in an embedded system can be time-consuming, but this is how most engineers must do it. When we talk to oscilloscope users, evaluating power-on and power-off sequences is one of the most common reasons engineers give for wanting more than four channels. In this article, we’ll briefly cover using a 4-channel scope for this purpose, and then we’ll show some examples using an 8-channel scope.
Traditional 4-channel oscilloscope approaches
One approach is to analyze the power system in blocks – using multiple acquisitions to check the timing block by block. To compare between blocks, one of the rails or a power good/fail signal can be used as a trigger and multiple captures can be taken, determining the startup and shutdown timing relative to the reference signal. Since acquisitions are taken over multiple power cycles, variations in the relative timing of supplies will be difficult to characterize. However, the range of variation of each supply from cycle-to-cycle can be determined by measuring over multiple power cycles using infinite persistence on the oscilloscope.
Another common approach is to “cascade” multiple scopes. This is usually done by triggering the scopes on one of the power supplies or on a common power good/fail signal.
Both of these approaches are time-consuming and require special attention to synchronization:
Dealing with synchronization and time uncertainty requires care
Aggregating data to develop a system timing diagram is possible, but time-consuming
Complexity increases with the number of power rails to be observed
Setups must be perfectly consistent
One measurement channel must be used to provide synchronization
Using an MSO to extend channel count
A mixed signal oscilloscope can provide additional channels for power supply sequencing. For this to work, the MSO must have suitable voltage range on the digital inputs and independently adjustable thresholds. For example, a Tektronix MDO4000C with the MSO option offers 16 digital inputs with independent thresholds for each channel and a ± 30 Vp-p dynamic range up to 200 MHz, making it suitable for most of the voltage levels you’d find in a typical design. Note that this approach works well if the objective is strictly to measure timing relationships, but it does not allow for measurement of rise/fall times or the shape (monotonicity) of the power-on/off.
8-channel scopes speed the process
Using an oscilloscope with 8 analog channels cuts the time and hassle significantly versus any of the methods covered so far. With an 8-channel oscilloscope, power supplies with up to eight power rails can be characterized using analog probes. To measure turn-on and turn-off timing relationships on power supplies with more than eight power rails, a mixed signal oscilloscope with digital signal inputs and independently adjustable thresholds can also be used.
Now, let’s look at some typical power sequencing measurement applications.
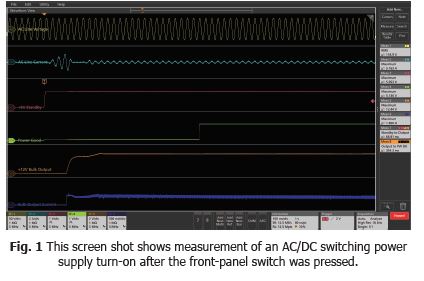
Turn-on delay with remote on/off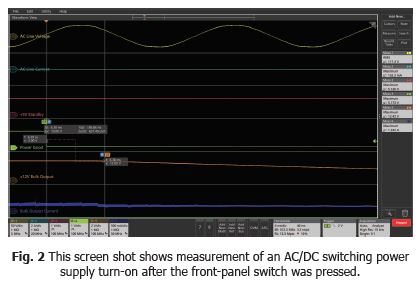
The switching power supply under test in the screen shot below produces a high-current, regulated 12 VDC output. This power supply is remotely controlled with a switch on the front panel of the instrument. Shortly after the switch is pressed, the +5 V standby voltage is turned on, enabling the switching converter to start. After the +12 V output is in regulation, the Power Good (PW OK) signal goes high to indicate to the load that the supply is reliable.
The +5 V standby voltage signal provides a simple rising edge trigger for the acquisition of the relevant signals. Automatic measurements verify that the delay to the output voltage turn-on is <100 ms, and the delay from output voltage turn-on to PW OK is in the specification range of 100 – 500 ms.
Turn-off delay with remote on/off
After the power supply’s main switch is turned off, the switching converter is turned off and the output voltage decreases. The power supply is specified to remain in regulation for at least 20 ms after the switch is pressed. Most importantly, the PW OK signal is specified to fall 5 – 7 ms before the +12 V output voltage falls out of regulation, allowing the load time to react and shut down cleanly.
As show below, the PW OK signal provides a falling edge trigger for the acquisition of the relevant signals. The waveform cursor measurement verifies that the PW OK pre-warning signal is operating as specified.
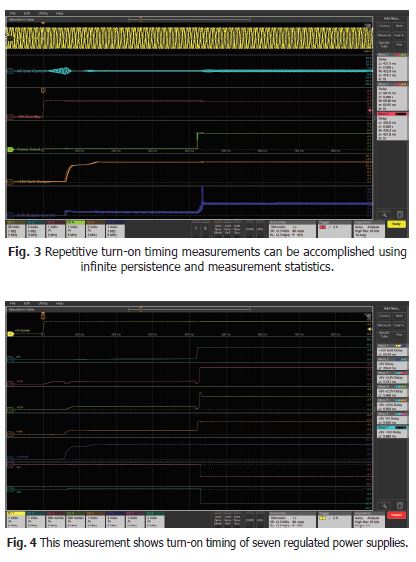
Verify timing over multiple power cycles
To verify that the power supply turn-on timing remains within specifications over multiple power cycles, infinite persistence can be used to display the signal timing variations and statistics displays of automated timing measurements quantify the variations. In the setup show below, the 50% point of the +5V standby voltage serves as the timing reference. The turn-on sequence is repeated 10 times and the timing variations over the 10 turn-on cycles are within a little over 1 percent.
Point-of-load regulated power supply timing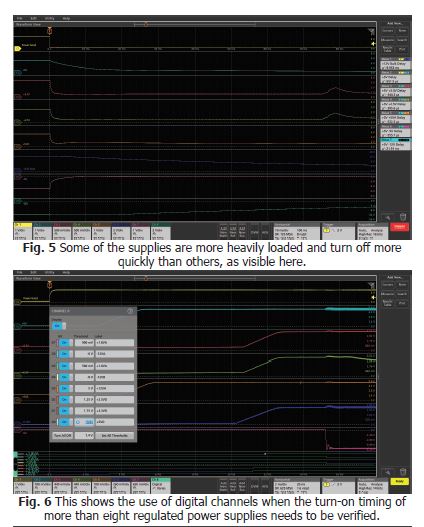
This screen capture below shows the turn-on timing of seven point-of-load supplies in a system board during power-up. The input power supplies to the circuit board are the +5V standby and bulk +12 VDC supply from the previous example.
The automated turn-on delay measurements in this test are made between the automatically-calculated 50 percent points of each of the waveforms, meaning that each measurement has a different configuration with a different set of measurement thresholds. The first measurement shows the delay from the +5 V standby signal to the bulk +12 V supply and the second measurement is the delay to the main +5 V supply. The remaining measurements are the sequence of critical delays from the main +5 V supply.
Turn-off timing of regulated power supplies
The automated turn-off delay measurements in this test are made between the points of each of the waveforms that are 5 percent below their nominal value. Unlike the previous percentage-based measurement thresholds, each measurement has an absolute voltage threshold. As the power supply shuts down, the Power Good signal falls. As you can see in the screen shot below, some of the supplies are more heavily loaded and turn off more quickly than others.
Turn-on timing of more than 8 rails
Automated timing delay measurements are simply based on the times at which the signals cross their respective threshold voltages. Since each automated measurement configuration can include a unique threshold value (typically 50 percent of the signal amplitude) and each digital channel can have a unique threshold value (also typically set to 50 percent of the power supply voltage), mixed signal oscilloscopes can make power supply timing delay measurements as shown below up to the number of available digital inputs. Depending on the MSO model, the number of channels can range from 8 to 64.
Power supply rise-time measurements
In addition to the power supply sequencing, the rise-times of power supplies must be controlled to meet the specifications of some critical components in a system. Automated rise- and fall-time measurements are also made based on voltage reference points which are, by default, automatically calculated to be 10 percent and 90 percent of the signal amplitude of each channel. In the simple example show below, the rise-times of the positive supplies and the fall-times of the negative supplies are shown in the results boxes on the right side of the display.
About the Author:
Dave Pereles is a technical marketing manager at Tektronix and has worked in the test and measurement industry in various roles including applications engineering and product management for over 25 years. He holds a BS in electrical engineering from Trinity College, Hartford, CT and an MBA from Seattle University.
