Targeting the Internet of Things, Wearables and Other Applications Requiring Extremely Low Power, Innovative New Tools Enable Developers to Identify and Eliminate Power Spikes During Development
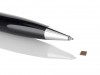
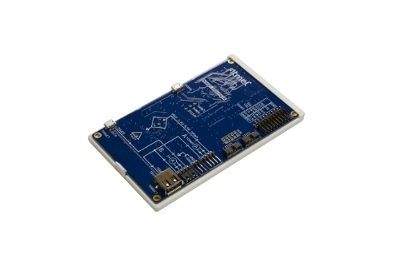
Atmel® Corporation (NASDAQ: ATML) announced a high-accuracy debugging tool that enables customers to visualize the power usage of their product during the development cycle. With ultra-low power being a critical factor in next-generation Internet of Things (IoT), wearable and battery-operated devices, being able to locate code where power spikes occur is crucial for supporting extremely low power in the overall design. The new Power Debugger is Atmel’s latest development tool for debugging and programming Atmel | SMART ARM® Cortex®-M-based MCUs and Atmel AVR® MCUs that use JTAG, SWD, PDI, debugWIRE, aWire, TPI or SPI target interfaces.
In addition to standard low-level debug functionality, the Power Debugger features two independent current-sensing channels for collecting real-time power measurements during application execution. The Atmel Power Debugger streams such power measurements collected to the Atmel Data Visualizer—available in Atmel Studio 7 IDE—for real-time analysis and display. The Data Visualizer graphs power usage in real-time and uses this data to estimate application battery life. The Data Visualizer also enables developers to correlate power samples with the code that was executing when the sample was taken, greatly reducing the time required to identify “hot spots” in the developers’ application.
“Lowering overall power consumption is key to many customer designs and essential for battery-operated and wearable designs,” said Steve Pancoast, Vice President of Software Development, Applications and Tools, Atmel Corporation. “Atmel provides cost-effective, easy-to-use tools that make it possible for our developers to profile the power usage of applications running on their own hardware as part of the standard development cycle. The Power Debugger is part of Atmel’s pledge to bring the latest tools to market, enabling developers to quickly get their prototype to production with the lowest power consumption.”
Availability
The Power Debugger is available for purchase from the Atmel web store: https://www.atmel.com/tools/atpowerdebugger.aspx/, and through Atmeldistributors.
More Information
Atmel Power Debugger: https://www.atmel.com/tools/atpowerdebugger.aspx
Atmel Studio 7: https://www.atmel.com/microsite/atmel-studio
Atmel START: https://start.atmel.com
Atmel | SMART MCU family: https://www.atmel.com/products/microcontrollers/arm/default.aspx
Atmel AVR MCU family: https://www.atmel.com/products/microcontrollers/avr/32-bitavruc3.aspx
Embedded Design Blog: www.atmelcorporation.wordpress.com
Atmel YouTube Channel at www.atmel.com/youtube
Twitter: www.atmel.com/twitter
Facebook: www.atmel.com/facebook
Linked In: www.atmel.com/linkedin