Whether an engineer is designing, developing or testing a new component, they will often use a network analyzer and a spectrum analyzer to fully understand the device under test (DUT). A vector network analyzer (VNA) measures or calculates informative responses such as S-parameters, gain compression and noise figure. A spectrum analyzer (SA) provides additional insights about the presence of harmonically related signals, non-harmonic spurious signals, and more.
During a typical troubleshooting session, the need to frequently connect, disconnect and reconnect the DUT to the VNA or SA will soon become inconvenient and time-consuming. One answer is to incorporate both capabilities in a single instrument.
Of course, the notion of performing basic spectrum analysis with a VNA is not new: this capability exists, to some extent, in a few previous-generation analyzers. Today, faster digitizers, digital signal processors (DSPs) and central processing units (CPUs) are making it possible to implement an SA capability that is fast enough to accelerate crucial—and oftentimes tedious—measurements such as spur searches.
Accelerating measurement speed
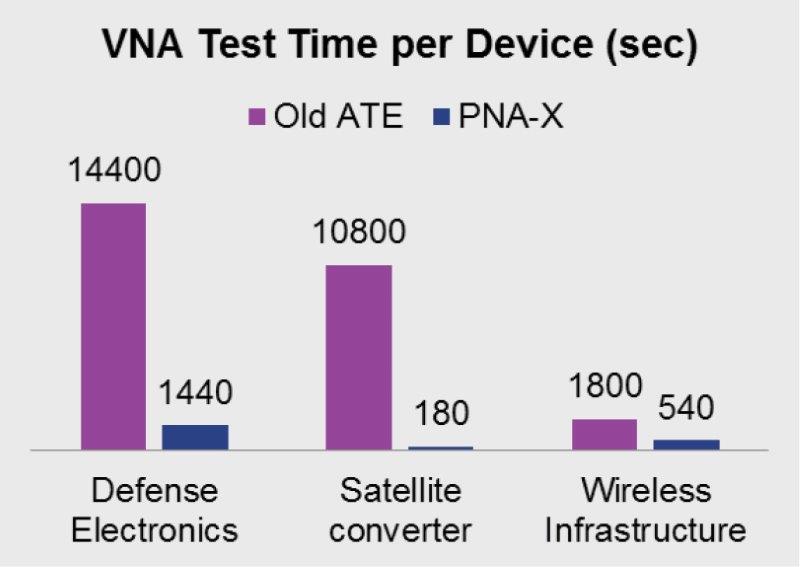
In the past several years, VNAs have become significantly faster in all essential measurement areas: match, gain/loss, noise figure, two-tone IMD, leakage, conversion gain, compression, delay, and more. Today’s most advanced models have cut test time per device by a factor of 10 in defense electronics measurements, by 6x in satellite converter measurements, and more than 3 times in measurements of wireless infrastructure devices (Figure 1).
Figure 1. Modern VNAs are providing significant reductions in test times across a variety of applications.
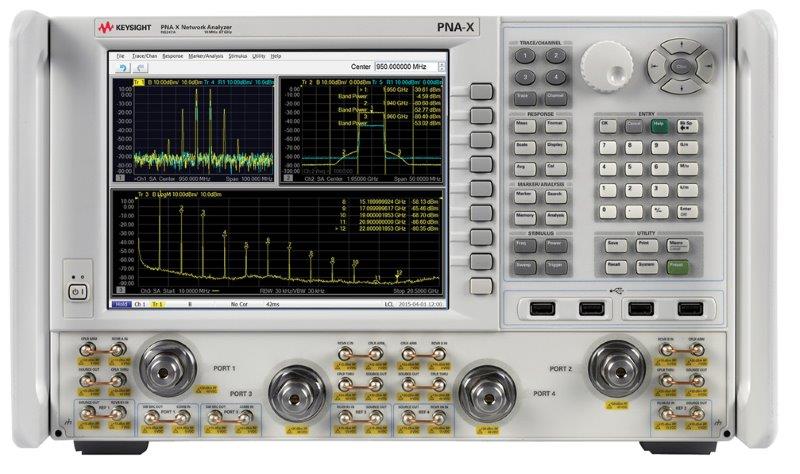
The technologies underlying these performance improvements were the necessary foundation for a high-performance spectrum analyzer capability. At Keysight, our goal was to find a new and better way to provide an SA capability in a VNA without altering the core architecture of the instrument. This led to Option 090 for the Keysight PNA Series vector network analyzers (Figure 2).
Figure 2. Adding a high-performance spectrum analyzer capability to an advanced VNA brings new levels of speed, convenience and insight to component testing.
This capability addresses the spur search problem in four ways. First, it provides fast searches over broad frequency ranges, up to 67 GHz, and test times are 10 to 500 times faster than a standalone SA when looking for medium-level spurs. Next, multi-channel spectrum analysis is synchronized with internal swept signal generators, providing additional insight into cause-and-effect. Third, it provides in-fixture spectrum measurements that benefit from the added accuracy of VNA calibration and de-embedding techniques. In addition, it is compatible with the single-connection, multiple-measurement (SCMM) capability of the PNA-X microwave network analyzers. With these solutions at hand, engineers have new ways to reach deeper insights into device performance.
Leveraging the existing architecture
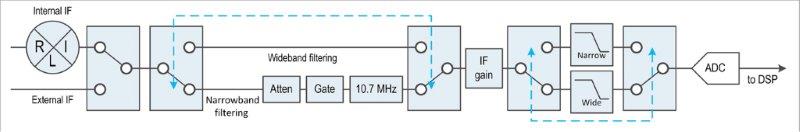
The proven block diagram of a microwave VNA is one of the reasons it delivers excellent measurement results. This is also why our design team wanted to leave the receiver block diagram untouched while adding meaningful SA capability (Figure 3).
Figure 3. To retain the expected level of VNA performance, the fundamental block diagram of the receiver was left intact.
As implemented in the PNA Series, the receiver has a bandwidth of 38 MHz and uses a wideband anti-aliasing filter. The 100 MSa/s analog-to-digital converter (ADC) has a theoretical maximum bandwidth of 50 MHz.
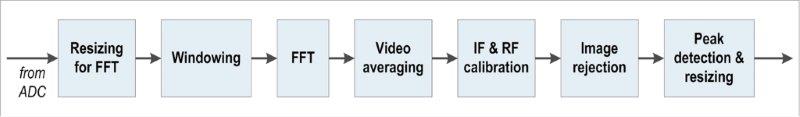
The key to success was the addition of a new data-processing flow that pulls digitized data from the output of the receiver ADC. Similar to any advanced signal analyzer, the process creates a finite-sized time record of data, applies a windowing function, and then computes a fast Fourier transform (FFT) to produce the frequency spectrum of the incoming signal (Figure 4).
Figure 4. SA-style processing and enhancement of digitized data provides fast and accurate spectrum measurements.
As shown, a few additional steps ensure an accurate and useful spectrum display: video averaging to reduce trace noise, calibration to ensure amplitude accuracy, image rejection to remove unwanted artifacts, and peak detection to enhance frequency accuracy.
One note: retaining the expected level of VNA performance precluded the addition of the hardware preselection filter or “preselector” used in standalone spectrum analyzers to block unwanted harmonics or mixing products (i.e., images). Within the data flow, the solution was the development of a powerful software-based preselector that is part of the SA capability. On the test bench, engaging this capability virtually eliminates images. In addition, the analyzer can be configured to make harmonic measurements on one or more channels using the receiver attenuator and a narrow resolution bandwidth (RBW) to reduce the displayed noise floor.
Solving the spur-search problem
Spurs are unwanted, nonharmonic signals that cause interference or false signals, reducing dynamic range in the DUT. The process of searching for spurs presents two challenges: time and complexity. The process of checking spurious performance is time-consuming, especially when searching for low-level signals over a broad frequency range. Characterizing spurs over the operating range of typical mixers and frequency-conversion devices tends to be tedious and complicated.
As an example scenario, suppose a spike appears in a conversion-gain measurement made with a VNA. When using a typical SA, simply viewing the output spectrum is not much help. Getting to the necessary detail requires a signal analyzer and one or more tracking generators, which can be built in or may be external units the SA can control.
Making the spectrum measurement requires several steps. First, disconnect the DUT from the VNA. Next, connect a signal generator to the DUT input and the SA to its output. Finally, configure the SA and signal generator to measure over the frequency range where the spur appeared in the conversion-gain trace. This may require measurements over one or more wide spans followed by several measurements made over narrower spans, one at a time.
This process is simpler and faster with the SA capability in the PNA. The VNA and DUT have three connections—LO, RF and IF—that enable the full complement of VNA measurements. In addition, the SA capability adds spectrum analysis across all ports of the DUT: RF input, RF output, LO input and IF output.
The ability to control multiple signal generators each spectrum analyzer channel provides additional insights into device behavior. For example, crossing spurs that affect fixed-output measurements are easily observed by sweeping the RF and LO sources over their respective frequency bands.
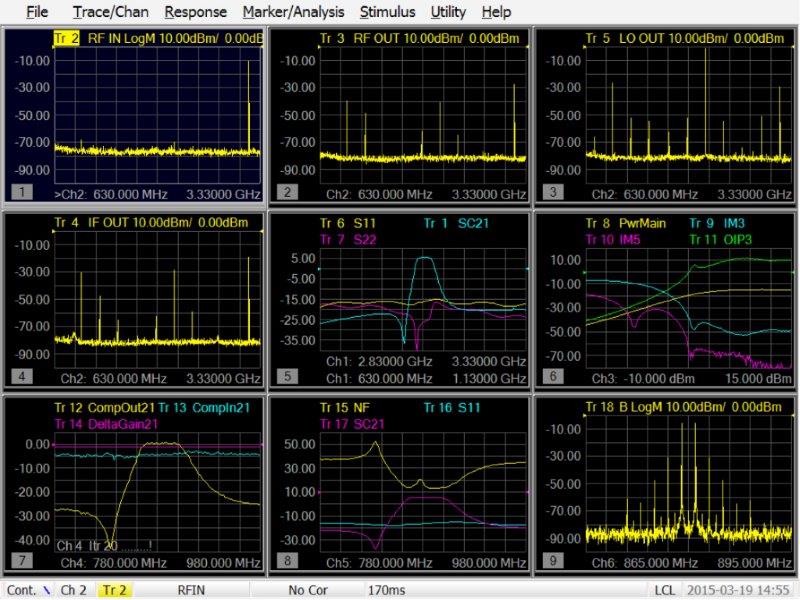
Using the existing connections to the DUT, a PNA or PNA-X can make multiple simultaneous network and spectrum measurements. With the SCMM capability in the PNA-X, a single set of connections is all that’s needed to measure input spectra, output spectra, gain compression, conversion gain, noise figure, two-tone IMD, and more (Figure 5).
Figure 5. Using the SCMM capability, this nine-trace display shows five spectrum measurements along with four VNA measurements including conversion gain (center), gain compression (bottom left) and noise figure (bottom center).
If an anomaly appears on a VNA trace, the user can place a marker at that point and use the “marker to SA” function to initiate a spectrum measurement that appears in a new window on the analyzer screen. As an added convenience, markers can also be used to perform band-power and noise-power measurements.
In-fixture and on-wafer measurements gain the benefits of VNA calibration and de-embedding, which correct receiver-response errors and also remove cable and fixture effects. The resulting improvement in test accuracy makes it possible to achieve narrower test margins and tighter device specifications.
On the production line, this capability makes it possible to remove a switch matrix and standalone spectrum analyzer from the test system. This addresses the increasingly important need to reduce the size and complexity of component-characterization test systems. It also helps system developers make better tradeoffs between test time and test coverage.
Achieving unrivalled excellence
Providing spectrum analyzer measurements inside a VNA is not a new idea. However, the technology available today—ADC, DSP, CPU—makes it possible to implement those measurements at a speed that makes them truly useful to engineers who are designing and testing advanced components.
When they’re characterizing active devices, the right mix of speed and performance provides a competitive edge. In R&D, this provides a level of measurement integrity that helps developers transform deeper understanding into better designs. On the production line, it ensures the throughput and repeatability needed to transform great designs into competitive products.
With the SA capability in the Keysight PNA series, the ability to make multiple simultaneous network and spectrum measurements lets those engineers gain deeper insights into their DUT and, ultimately, achieve unrivalled excellence in their measurements and their designs.
For more information, please visit www.keysight.com/find/PNA-SA.
Led by Glilot Capital Partners and Ten Eleven Ventures, Bloom Security introduces endpoint security purpose-built…
Israeli semiconductor company Xsight Labs has closed a funding round of more than $300 million,…
Qedma’s quantum error reduction software, running on IBM quantum computers and tested against RIKEN and…
Israeli startup Modus has emerged from stealth with a $10 million seed round led by…
Series C funding led by One Peak brings total investment in the company to $160…
Industry-leading product line card increased by more than 373,000 products last quarter THIEF RIVER FALLS,…