

Electricity usage costs have become an increasing fraction of the total cost of ownership (TCO) for industrial pumping systems. In fact, energy cost represents 40% of the TCO of a typical pump. It is possible to reduce the electrical consumption by at least 30% through appropriate energy management practices while reducing the maintenance cost. This paper explains how to reduce TCO with a limited investment.
-

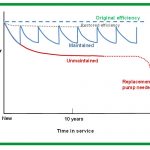
- Figure 1: Typical pump life-cycle cost profile (Courtesy of Hydraulic Institute and Pump Systems Matter)

-
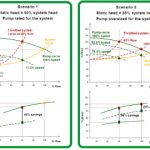
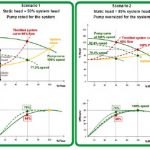
- Figure 2: Energy saved with variable vs. fixed speed drives at 100% and 60% flow, according to the static head and pump sizing. The operating point is represented as the intersection of the pump curve with the system curve
-
- Figure 3: Comparison of two efficiency scenarios at different flow rates: 8 to 9% more efficient with variable speed drives at 60% flow
Introduction
Wherever pumping systems are present–in environments such as buildings and water/wastewater and oil and gas facilities–energy consumption exerts a major influence on cost. Despite the fact that electrical energy cost represents 40% of the total cost of ownership (see Figure 1) of pumping systems, many organizations fail to introduce the proper steps to leverage cost reduction through efficiency improvements. To solve this dilemma, the following major barriers need to be recognized and addressed:
• Lack of proper metrics – Energy efficiency has traditionally not been used in assessing performance. In most organizations, the responsibilities of energy procurement and efficient operations are separate and consistent / standardized metrics are not utilized.
• Knowledge gap – A lack of awareness in energy efficiency opportunities is prevalent and, as a result, potential savings and other benefits are missed.
• Fear of investment – Operations personnel often struggle to present attractive large or even small investments to their finance organizations (fig 1).
This paper demonstrates how deployment of an energy management plan, with limited investment, can provide reductions in pumping systems TCO while maintaining sustainability objectives. Any sound energy plan should take into account the following three steps:
1. Energy efficiency management
2. Asset management
3. Energy cost management
For the purposes of this paper, the scope of a pumping system will be defined as encompassing all related elements starting from the point of the electrical utility connection down to the point of end use. This paper will illustrate how energy management best practices can result in a 20% reduction in TCO and a return of investment (ROI) within 24 months.
Step 1: Energy efficiency management
Energy efficiency is now a global high priority for both industrialized and emerging countries. The Rio conference and Earth Summit of 1992 and the Kyoto Protocol of 1997 resulted in the signing of a global treaty that sets binding targets for reduction of greenhouse gas emissions.
The International Energy Agency (IEA) and various governments and non-governmental organizations (NGOs) agree that the reduction of CO2 emissions and the resulting energy savings can be achieved through the deployment of energy efficient products and systems.
The challenge, however, is that the nature of production in industrial environments is in a constant state of flux. Production cycles, for example, are influenced by variables such as market demand, weather, and local regulations. As a result, factory and building operators need to understand how and when energy is used in order to minimize consumption and related costs.
The pump system energy management approach discussed in this paper will review the nature of efficiency loss not only for individual components within the system, but also for the system as a whole, integrated entity.
-
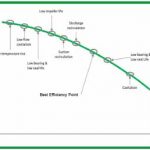
- Figure 4: Maintenance related issues that impact pump performance (Courtesy of Barringer & Associates- “Pump practices & life”)
-
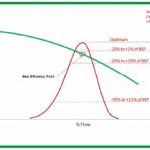
- Figure 5: Effect of the distance from the BEP on reliability (Courtesy of Barringer & Associates – “Pump practices & life”)
-
- Figure 6: Average wear trends for maintained and unmaintained pumps (Courtesy of ETSU – Energy Savings in Industrial Water Pumping Systems)
-
- Table 1: Alignment of motor efficiency categorization levels from the various geographical regions

In pumping systems, most inefficiency comes from:
• A mismatch between the pump deployed and the actual system requirement (i.e., undersized or oversized)
• The improper use of throttling valves and damper technologies to control the flow of liquids
These two elements imply that the way pumping systems are controlled plays a major role regarding how efficiency can be improved. Control systems themselves are composed of both hardware and software components. On the hardware side, variable speed drives are a primary enabler of high efficiency performance.
The example in Figure 2 on page 3 compares two installations (one with a variable speed drive one with a fixed drive throttled system) in which static heads (height difference between the source and the end use) are different.
• At fixed speed (the throttled system example), it is necessary to add a throttle valve in the hydraulic circuit. This adjusts the flow by increasing or decreasing the flow resistance. This will modify the system curve. However, the speed remains the same so the pump curve does not change. The flow rate is matched but the head is much higher than required resulting in poor energy savings.
• If a variable speed drive is deployed, the system curve does not change. The pump curve is modified according to flow speed and affinity laws (rules of hydraulics that express the relationship between variables involved in pump performance such as head, volumetric flow rate, shaft speed, and power). Adjusting the speed matches the process requirement and results in significant energy savings.
Energy savings depends on the static head: the lower is the static head, the bigger the energy savings (and speed variation range). In order for a pumping action to occur, it is necessary to generate enough power to overcome the static head. The friction head is the amount of head required to push the liquid through the pipe and fittings. It depends on flow rate, pipe size, pipe length, and viscosity.
• Scenario 1 (Figure 2): the static head represents 50% of the system head, and the pump is rated for the head and flow of the system. At 100% flow, the power consumed by the pump is the same at both fixed speed and with a variable speed drive. At 60% flow, the energy savings resulting in the variable speed drive use is 46%.
• Scenario 2 (Figure 2): the static head represents 85% of the system head, and the pump is oversized by 20%. In real world scenarios, 75% of pumps are oversized (by 10% to 30%) in order to meet anticipated lifetime peak production, to anticipate future needs, or to rationalize spare parts inventory. Therefore, a variable speed drive saves 20% of energy at 100% flow and saves 36% energy at 60% flow.
Changing the operating point on the pump curve also changes the efficiency of the pump itself. The pump performs at maximum efficiency at its full capacity. This corresponds to what is referred to as the Best Efficiency Point (BEP). In terms of installation design and operation, the objective is to work as closely as possible to the BEP. By varying the speed, the pump efficiency remains roughly the same but is applied to a new flow rate. At fixed speed, reducing the flow rate quickly deteriorates the pump efficiency (because it works far from the BEP) while adjusting the speed keeps the efficiency close to the BEP (see Figure 3).
Determining pump efficiency is only a first step in identifying system performance levels. Monitoring efficiencies via software can detect operating points that are not suitable for the pump. Access to such data can help to improve both system energy efficiency and reliability.
-
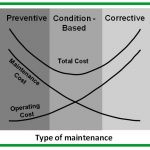
- Figure 7: Cost curves of the different maintenance approaches (Courtesy of Penn State University / Applied Research Laboratory – “Open systems architecture for condition-based maintenance”)
-
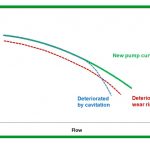
- Figure 8: Worn pump curve vs. new pump curve
-
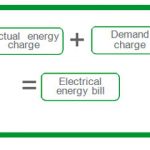
- Figure 9 Fundamental elements of a typical industrial electrical bill
Summary of pump energy efficiency management best practices
The energy efficiency of a pumping system can be improved by implementing the following simple actions:
• Replace fixed drives with variable speed drives to boost the efficiency. Connected to a pump, a variable speed drive can control speed, pressure, and flow in conjunction with dynamic process and production requirements.
• Monitor production data and energy consumption data via software dashboards. Continuous tracking of the deviation between production output and energy consumed allows for rapid and cost effective decision-making. Intelligent Electronic Devices (IEDs) such as variable speed drives that are tied into the monitoring system, play a major role in reporting data related to operation, production, and energy in real time. Monitoring points should be close to the load because that is where most of the power is consumed. The closer the monitoring is to the load, the more insights can be acquired relative to cost savings.
• Monitor the operating point of the pump and its efficiency on a continual basis in order to visualize trends. Observance of the trends can then lead to sensible actions that improve efficiency, and verify the impact of improvements to the system.
• Use proper metrics to identify an increase or decrease in efficiency on particular systems and to compare efficiency performances of different pumps in multiple sites. A recommended key performance indicator (KPI) metric is the specific energy consumption metric (in kWh/ m3).
Efficiency standards: Motors
In the realm of efficiency improvement, motors play an important role as part of the overall pumping system. In 2008, the International Electrotechnical Commission introduced the IEC60034-30 and IEC60034-31 standards as an efficiency classification system for motors. Countries have published laws and regulations based on these standards and require the usage of more efficient motors in order to reduce CO2 emissions. Table 1 aligns the various levels of standards across different geographical regions.
Over the next several years, government regulations will require higher efficiency motors. European Union countries that require IE2 motors today will require either IE3 motors or IE2 motors with variable speed drives in 2016. An IE3 motor will increase efficiency by 2% for 4kW / 5HP motor power when compared to an IE2 motor, and by 1% for a 90kW / 125HP motor. Although these gains are significant, if variable speed drives are deployed, the potential for further efficiency gain is greater.
Efficiency standards: Pumps
As with motors, new standards and regulations have been adopted in the domain of pumps. The European Commission (EC), for example, has adopted regulation n°547/2012 under Directive 2009/125/EC in regard to eco-design requirements for water pumps. The EC regulation is intended to suppress the availability of low efficiency water pumps. It is applicable in the European Union to rotodynamic water pumps for pumping clean water.
The EC regulation defines a Minimum Efficiency Index (MEI) for affected pumps. The MEI is a criterion based on evaluation of European pump manufacturer statistical data, on technological aspects, on fluid dynamic laws, and on operating points included between 75 and 110% of the BEP flow rate.
According to regulation n°547/2012, as of January 1st 2013, pumps must attain an MEI of higher than 0.1. This affects the manufacturers of pumps because 10% of their configurations have been rendered obsolete. As of January 1st 2015, new pumps being sold to end users must attain an MEI of 0.4 or higher. That means that 40% of manufacturers’ current inventory will be rendered obsolete. The efficiency increase between MEI 0.4 and 0.1 is around 5%.
In order to further expand efficiency gains, the European Union has requested a new directive which defines a broader view of the pumping system. Moving forward for efficiency measurement purposes, a pumping system will include the pump, the motor, the load profile and the variable speed drives. This will result in a potential savings of 30% compared to 3.6% with the current “pump only” approach.
The IEC regulation n°547/2012 does not yet include fire fighting pumps, self priming pumps, displacement pumps, pumps for private and public wastewater and for fluids with a high solids content, pumps for swimming pools, pumps for fountains, and clean water pumps larger than 150 kW. (In many of these areas preparatory studies are underway for the future development of new efficiency standards).
Other regions in the world have defined their own minimum energy performance for pumps. The calculation method in Brazil is similar to the EU approach. In China, the regulation GB19762-2007 is applicable for clean water pumps. That regulation defines 3 grades where grade 1 is used for very high efficiency pumps. Grade 3 is the minimum efficiency authorized. The method of calculation used to define the grade is different from the method used by EU regulation. The US Department of Energy (DOE) has begun work evaluating new energy standards for pumps. The DOE has published a rulemaking framework and has shared documents regarding commercial and industrial pumps with manufacturers, consumer groups, federal agencies, and states in order to gather feedback.
Step 2: Asset management
Physical assets such as pumps need to be maintained on an ongoing basis. Maintenance costs represent 25% of TCO (see Figure 1) and therefore maintenance practices warrant examination in terms of contribution to energy-influenced savings. Maintenance costs are unavoidable due to the wear of components during system operation, and because the cost of downtime attributed to loss of production would threaten the solvency of the business. In pumping installations, many moving parts mean that proper maintenance of motors, drives, pumps, and associated pipes is crucial. Numerous steps can be taken to assure that maintenance costs are kept at a minimum while integrity of the systems is kept stable.
All pumps should be operated within the parameters of a given pump’s specifications (often stated in the pump supplier’s instruction manual / data sheet). As discussed, pump efficiency varies according to operational parameters. The pump is designed for optimal operation at the best efficiency point (BEP) but 75% of the pumping systems are oversized by around 30%. Figure 4 (previous page) illustrates how pumps begin to waste significant efficiency when appropriate maintenance practices are neglected. For example, discharge recirculation can occur if the pump operates at 65% of the BEP flow rate, causing damage to the impeller, and a damaged impeller will be less efficient.
Variable speed drives can help to keep the operating point close to the BEP and also protect the pump against destructive forces generated by inefficiencies. Extreme situations such as dry running, low flow operation, or cavitation (due to low net positive suction head) which can cause instantaneous damage are avoided. Monitoring the operating point of the pump and its efficiency provides diagnostics that can help predict when potential system problems will occur.
Figure 5 illustrates how operating away from the BEP not only decreases the efficiency but speeds up the wear and tear on the pump thereby reducing reliability. For example, operations run at 60% of BEP result in:
• 50% lifetime reduction of seals
• 20% lifetime reduction of bearings
• 25% lifetime reduction of casing and impeller
• Approximately 100% increase of maintenance cost
Wear is unavoidable due to mechanical parts that are moving and to the action of the fluid being pumped. Erosion is generated by the speed of fluid, and it could be increased by slurries (sand or bigger particles). Corrosion is due to chemical or electrochemical reaction that attacks the pump materials. Even treated drinking water causes corrosion in cast iron casings as a result of the catalytic effect of bacteria. Erosion and corrosion mostly impact the pipes, the impeller, and the case (which are key operating components).
Efficiency drops by 10 to 15% for an unmaintained pump (see Figure 6). Moreover, the major loss in efficiency occurs in the first few years of the pump’s life. Regular maintenance avoids losses in efficiency and capacity which can occur before the pump fails.
Some of the factors that debilitate a pump are visible. Others are not. For example, a worn seal is apparent. However, hydraulic wear is not. A problem that is not visible occurs before it is identified. This creates a situation of urgent corrective maintenance, and the defects may have affected other parts of the pump.
Maintenance practices
A number of approaches are available that can help to address the issue of maintenance in a cost effective manner. Preventive maintenance implies the systematic inspection and detection of potential failures before they occur. Condition-based maintenance is a type of preventive maintenance, which estimates and projects equipment condition over time, utilizing probability formulas to assess downtime risks. Corrective maintenance is a response to an unanticipated problem or emergency.
Figure 7 illustrates the cost curves of these three types of maintenance. Condition-based maintenance is the most cost effective of the three approaches.
Condition-based-maintenance monitors system data on an ongoing basis and provides an accurate assessment of the health, or status of components, devices, and / or the complete system.
As it relates to pumps, variables such as suction pressure, discharge pressure, pump speed, power, flow, and temperatures are monitored to detect a loss of efficiency. Identification of the potential problems is possible by combining the efficiency trends and process variables.
Variable speed drives have the capability of measuring process variables, temperature and power with high accuracy and to assess the pump efficiency. If connected to the automation system, they continuously monitor the health of the system and can indicate in a precise manner when proper maintenance is needed.
Figure 8 illustrates how a warn part can impact the pump efficiency curve.
Pipes
As part of the overall pumping system, pipes are also subject to issues such as overpressure, leakage, or pipe burst. An overpressure situation can be caused by poor pump control. A situation called “water hammer” can also occur. Water hammer is caused by a pressure or shock wave that travels through the pipes, generated by a sudden stop in the velocity of the water. This sudden acceleration and deceleration on the motor can be avoided with the help of a variable speed drive (sudden variation in flows is avoided). Leakage can also be reduced by automatic adjustments to pressure when appropriate.
Motors
Protection against mains voltage and frequency fluctuations can help maintain the integrity and extend the lifetime of motors. In cases where motors are equipped with variable speed drives, those electrical disturbances are not transmitted to the motor.
Protection against high temperature conditions can also extend the life of the motor assets. Devices such as thermal relays, PTC or PT100 thermal sensors can help and are manageable through the variable speed drive.
In cases where long motor cables are used in conjunction with motors and variable speed drive, it is recommended that filters be installed in order to avoid the dv / dt and motor voltage surge effects (see the Schneider Electric white paper “An Improved Approach for Connecting VSD and Electric Motors” for more details on this subject). Note: For submersible bore hole pumps, it is recommended to verify the peak to peak voltage and the dv / dt at the motor terminals with the motor-pump supplier.
Step 3:
Energy cost management
Building owners, water / wastewater and oil and gas facilities operators are presented with utility bills that have multiple components. These can include power demand charges, energy demand charges, time-of-use charges, ratchet clauses, cost-of-fuel adjustments, power factor penalties, customer service charges and national, regional, and local taxes. A misinterpretation of utility rate structures can lead to poor management of electrical consumption and to higher costs.
Most energy bills cover similar basic elements (see Figure 9). Familiarity with the terms can help to understand where the opportunities for cost reductions exist.
Below are some definitions for common terms used:
Customer charge – This is a fixed charge that depends upon the size of the connection that links the industrial installation in question to the electrical utility network. The customer charge is calculated according to an anticipated power consumption range, and the price of the actual power that is consumed. Both of these elements are influenced by the type of contract that has been signed between the corporation and the utility.
Actual energy charge – This charge corresponds to the consumed active energy, which is the cumulative energy consumed over a given period of time. The kilowatt hours (kWh) rate depends upon the time period the energy was consumed, and whether that consumption occurred during “peak” and / or “off peak” hours.
Demand charge – This charge represents the highest average power consumed within any 15 minute time period over the span of a month’s time is tracked by the utility. This number is then multiplied by the demand charge rate in order to produce the demand charge that appears on the electrical bill. That means consumers are charged for a peak demand even if it only happened once during the month.
Power factor penalty – The power factor is the ratio between the active power (that generates work) and the apparent power (that could potentially be used to generate work). That means that a certain portion of the power that is delivered by the electrical utility to the industrial site is not billed (because it did not generate work). If the power factor is less than the given value mentioned in the contract (say around 0.9), the consumer is invoiced for the power factor (reactive power). A lot of equipment or devices have power factor lower than 1: motors, induction furnaces, transformers, variable speed drives, computers, fluorescent lighting.
Best practices for energy cost reduction through bill management
The electrical energy bill for the site can be reduced by implementing the following series of simple actions:
• Locate and review the utility contract itself to better understand the charges associated with the bill and how they can be controlled. Up to 10% savings without any capital investment could be achieved with the support of a company specialist in energy management.
• Adjust the timing of energy usage from the peak rate period to the off peak period as much as is possible (e.g. by controlling differently reservoir and pumping operations).
• Reduce the monthly peak demand number in order to reduce the demand charge. In most cases, 75% of the applications are oversized. Variable speed drives, which can reduce power demand by 20%, are a technology that helps organizations to size according to process requirements.
• Power factor penalties that are due to motor and that mitigate harmonics at 48% of THDi for 80% load, can be canceled out by deploying variable speed drives to pumps.
• Reduce the amount of energy that is consumed that is not linked with revenue generation. An active control of the leakage will significantly reduce the operational cost.
Conclusion
By pursuing best practices in energy efficiency management, asset management, and energy cost management, total cost of ownership of pumping system networks can be reduced by up to 20%. One simple technology, the variable speed drive with embedded energy management functionality, has the capability of being a major contributor to achieving achieve the TCO target.
The variable speed drive is fully integrated in the numerous steps that can be taken in order to implement an effective energy management plan. These include adopting energy efficient technologies, implementing condition-based maintenance practices, and optimizing cost control of the electrical bill. The linking of pumping processes to energy systems helps to improve business performance through better energy management.
Organizations that are ill equipped to jumpstart an energy efficiency program should seek the assistance of mission-critical subject matter experts. The alternative invites unnecessary delay, risk, and expense.
To achieve operational sustainability, organizations must act quickly to assess their current programs and begin building an operational methodology that emphasizes improvement in energy efficiency.


